
Material Topic: Emissions
305–1 Direct (Scope 1) GHG emissions
Boliden reports this indicator for the units over which it has operational control. The direct carbon dioxide emissions arise primarily from the use of carbonaceous reducing agents, from fuels in metal extraction processes, and from the use of fuels for mining operations and road transportation within the company.
The direct emissions are calculated in accordance with the procedures laid down in the WBCSD GHG Protocol, together with additional guidelines from the EU and/or national authorities.
Note. Data in this GRI Report were compiled before the EU-mandated ETS reporting to the national authorities. The CO₂ reporting within the framework of ETS is carried out in accordance with separately audited procedures in each country, and although we seek to report the same data, we cannot guarantee that the Group’s GRI disclosure will correlate exactly to the CO₂ data reported within ETS.
305–2 Energy indirect (Scope 2) GHG emissions
Boliden reports this indicator for the units over which it has operational control and includes only production-related indirect emissions. Commencing in 2015 Boliden began using location-based emission factors. This was an adaptation to the updated GHG Protocol Guidelines for Scope 2 reporting. The calculation is made by multiplying the energy used with the production mix for the specific region. The production mix should be as current as possible, and Boliden uses emission factors published by International Energy Agency. For the 2017 reporting, the following emission factors were applied: for the operations in Sweden 11 (13), Finland, 147 (175), Norway 8 (8), and Ireland 425 (435) g/kWh.
|
Carbon dioxide emissions, |
2015 |
2016 |
2017 |
|
Direct emissions, (305-1) |
559,000 |
594,000 |
605,000 |
|
Indirect emissions, (305-2) |
330,000 |
459,0001) |
419,000 |
|
Total (305-1 + 305-2) |
889,000 |
1,052,0001) |
1,024,000 |
1) The indirect emissions for 2016 have been corrected to 459,000 from 404,000 t due to an incorrect calculation in the previous GRI report disclosure.
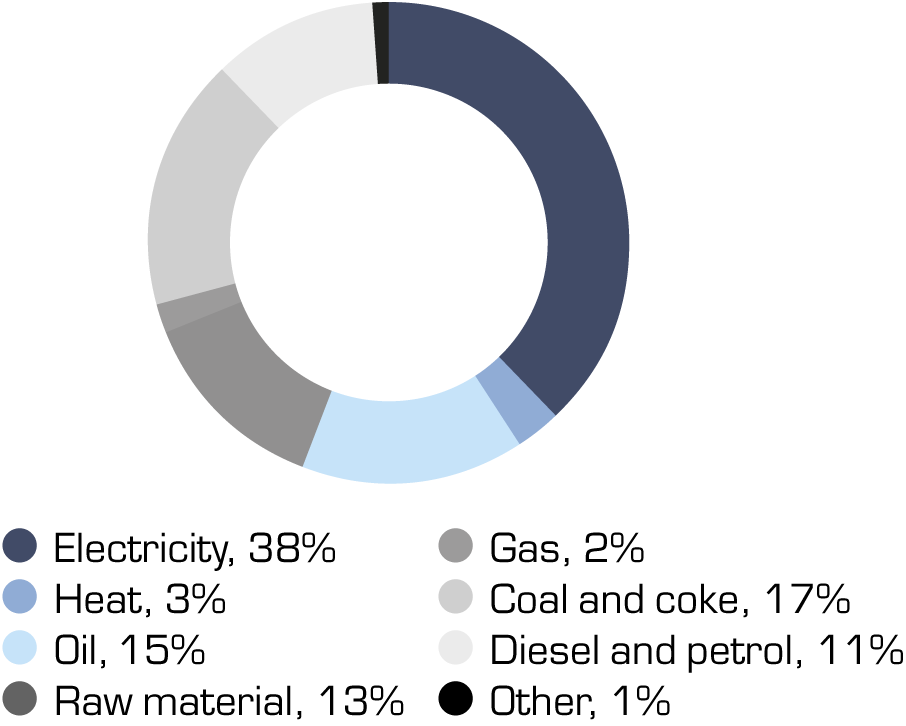
Carbon dioxide emissions (Scope 1 + Scope 2), 2016 per source
The total reported CO² emissions are 1.024 (1.052) Mtonnes for the year.
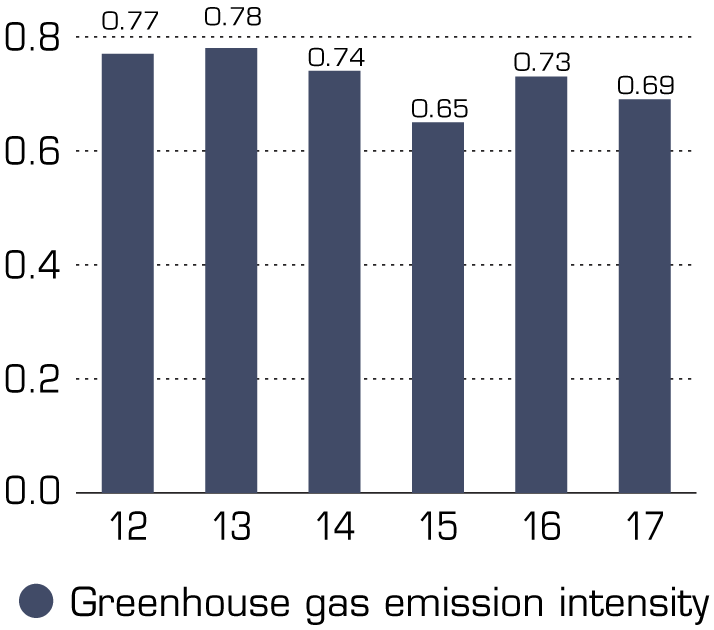
Boliden’s GHG intensity was 0.69 (0.731)) t/t metal. The GHG intensity is reported as the product emission intensity (metric tonnes of direct [Scope 1] and indirect [Scope 2] emissions per unit of metal product). Boliden only includes CO₂ gas in the GHG intensity.
Greenhouse gas emission intensity
t CO²/t metal
The GRI definitions state that this indicator should reflect reductions of CO₂ emissions identified under 305-1 and 2. The reductions result is estimated from reported energy savings and energy efficiency initiatives reported in 305-2.
Boliden strives to deliver the excess heat from its processes for use in district heating, whenever possible. The heat supplied by Boliden Bergsöe, Boliden Rönnskär, Boliden Kokkola and Boliden Harjavalta in 2017 corresponds to 270,000 t/a of CO₂ (Scope 1) if the same amount of heat had been produced from a fossil-fuel source.
Boliden is also, over and above these measures, actively initiating attempted reductions in fossil-fuel emission by means of fuel substitution tests, participation in demonstrations of electrified road transports, and improved heat recovery/exchange with the aim of phasing out the use of fossil fuels for heating purposes.
Boliden is a co-owner of a production company for wind-based power, VindIn AB, which builds and operates wind farms in Scandinavia. The purpose of VindIn is to take a longer-term approach and to deliver low-cost, renewable electricity. VindIn currently produces about 300 GWh in its three wind farms in Sweden and Finland.
305–7 Other significant air emissions
Other significant air emissions deriving from Boliden’s operations are nitrogen oxides (NOx), sulphur oxides (SOx), metals, and dust. The most common of the sulphur oxides (SOx/SO₂) is sulphur dioxide, and Boliden generally uses the expression ‘sulphur dioxide’ to describe this emission. The figures for sulphur dioxide and NOx disclosed in the table are the direct measured emissions from sources at Boliden’s smelters. The figures for metals and dust include the direct-measured emissions from smelter stacks but exclude diffuse emissions. Air emissions from mobile equipment and the use of explosives have earlier been estimated by Boliden but are currently being assessed as not material in relation to the direct-measured emissions.
Diffuse emissions are generated at both mines and smelters and the environmental impact is due to dust particles containing metals being dispersed by the wind. All operations are working systematically to reduce particle emissions to air, e.g. by enclosure of dust-generating equipment and by salting and watering roads. The diffuse emissions are monitored but are difficult to quantify in an aggregated manner.
Emission Reduction Efforts
Boliden’s efforts to reduce emissions are based on an overall analysis of the environmental impact. The impact and risk assessments are revised on a regular basis, as are the measures to be taken. The work is controlled and conducted by each individual business unit, as local circumstances may differ. Follow-up at the Group level is conducted on a monthly basis.
Sulphur dioxide emissions to air are mainly attributable to gases generated during the smelting processes at the Harjavalta and Rönnskär copper smelters. The amount of sulphur dioxide emitted during the process depends on such factors as process stability and the efficiency of the gas cleaning systems, and, to some extent, on the amount of sulphur in the raw material. One way of reducing emissions is, therefore, to control the smelting process and to allow emission levels to be a factor when deciding which raw material to smelt. The monitoring and control of abatement systems for effective gas cleaning is important work and is carried out continuously.
The ongoing work focuses on process stability and improvement and/or replacement of technology. Emissions to air are mainly based on periodic monitoring in accordance with applicable national standards. Emissions from fuel are calculated using the fuel properties data provided by the supplier. Accredited laboratories, both internal and external, are used for the analyses of samples taken on site.
|
Emissions to air (tonnes) |
2015 |
2016 |
2017 |
|
NOx |
410 |
380 |
450 |
|
SO2 |
7,210 |
7,060 |
7,360 |
|
Particulate matter |
66 |
110 |
193 |
|
Metal emissions to air (me-eq) |
88 |
100 |
109 |
|
Metal emissions to air (mass) |
18 |
22 |
21 |