
Water
Water management and conservation is an important part of our environmental work.
Our approach to water
All Boliden’s units shall have a Water Management Plan in place by the end of 2025 to consider many critical operational aspects, such as water scarcity, pollution and flooding. Water risk assessments are regularly undertaken to evaluate potential impact on the business, operations, revenue or expenditure.
Protecting water as a shared resource
Our operations are situated in areas with little water scarcity, and no water sources are significantly affected by water withdrawal caused by Boliden’s operations. None of Boliden’s operations are located within an area of high or extremely high-water stress as defined by the World Resource Institute. We aim, nonetheless, to have a good understanding of current and future water use and reduce both our consumption of freshwater and the discharge of used water. Water risk assessments are undertaken regularly to evaluate potential impacts on our business, operations, revenue and expenditure. No major incidents of non-compliance associated with water quality permits, standards and regulations occurred during the year.
Management of water discharge-related impacts
In mining, water is typically used in mineral processing and slurry transport, while in smelting, it is used for cooling and gas cleaning purposes. Our operations do not reuse water from other organizations, but at Harjavalta and Kokkola, wastewater from adjacent operations is partly treated in our wastewater treatment plants before being either returned or discharged.
|
Water recycled and reused (million m³) |
2020 |
2021 |
2022 |
|
Recycled volume |
206 |
201 |
203 |
|
Percentage of water recycled |
58% |
59% |
58% |
Water withdrawal
Water volumes are measured and/or calculated for each site using flow meters and/or the monitoring of pump operating data. The potential to break down water withdrawn by freshwater and other sources of water is currently under investigation.
|
Total water withdrawal |
2020 |
2021 |
2022 |
|
Surface water (sea) |
80 |
84 |
90 |
|
Surface water (inland) |
44 |
36 |
35 |
|
Groundwater |
19 |
17 |
18 |
|
Collected rainwater |
1 |
1 |
1 |
|
Municipal water |
2 |
2 |
2 |
|
Total water withdrawal |
147 |
141 |
147 |
Water discharge
Discharges to water derive from dams and tailings ponds at our mines, and from water treatment plants and the collection of surface water (rainwater) at both our smelters and mines. At Kokkola’s zinc smelter, drainage and surface waters collected from landfill areas are also processed and treated at the site’s water treatment plant. Boliden’s smelters account for approximately 80% of the Group’s metal discharges to water. Boliden’s mines account for approximately 75% of the Group’s nitrogen discharges with the nitrogen mainly resulting from the use of explosives and their handling.
Ensuring efficient and stable operations at our water treatment plants as well as recirculating process water are important steps to reduce discharges to water. Our operations include purifying process water as well as a significant amount of rainwater that falls within our industrial areas. The volume of discharged water and emissions are monitored frequently according to approved monitoring programs at the point where discharges are sent to receiving water bodies.
To promote good ecological and chemical water conditions close to our operations, the status of aquatic environments is monitored regularly at several sampling points where water is discharged. Aquatic environments that receive water discharges are monitored to assess their status compared with local, national and/or European environmental quality standards. The quality of water, sediment and biota in marine and freshwater environments is monitored according to monitoring programs approved by the relevant authorities.
|
Water discharge |
2020 |
2021 |
2022 |
|
Metal discharges to water, metric tons (me-eq) |
37 |
47 |
67 |
|
Metal discharges to water, metric tons (mass) |
12 |
14 |
13 |
|
Nitrogen / N-tot / to water metric tons (mass) |
201 |
276 |
237 |
|
Discharged water volume (million m3) |
2020 |
2021 |
2022 |
|
To wetland |
0 |
0 |
0 |
|
To inland surface water |
47 |
56 |
50 |
|
To sea surface water |
85 |
77 |
96 |
|
To municipal treatment plants |
0.03 |
0.03 |
0.03 |
|
Total |
132 |
133 |
146 |
Water consumption
Our water consumption is calculated from the difference between the total water withdrawal and the water volume discharged by our sites.
|
Water consumption |
2020 |
2021 |
2022 |
|
Total water withdrawal |
147 |
141 |
147 |
|
Discharged water volume |
132 |
133 |
146 |
|
Water consumption |
15 |
8 |
1 |
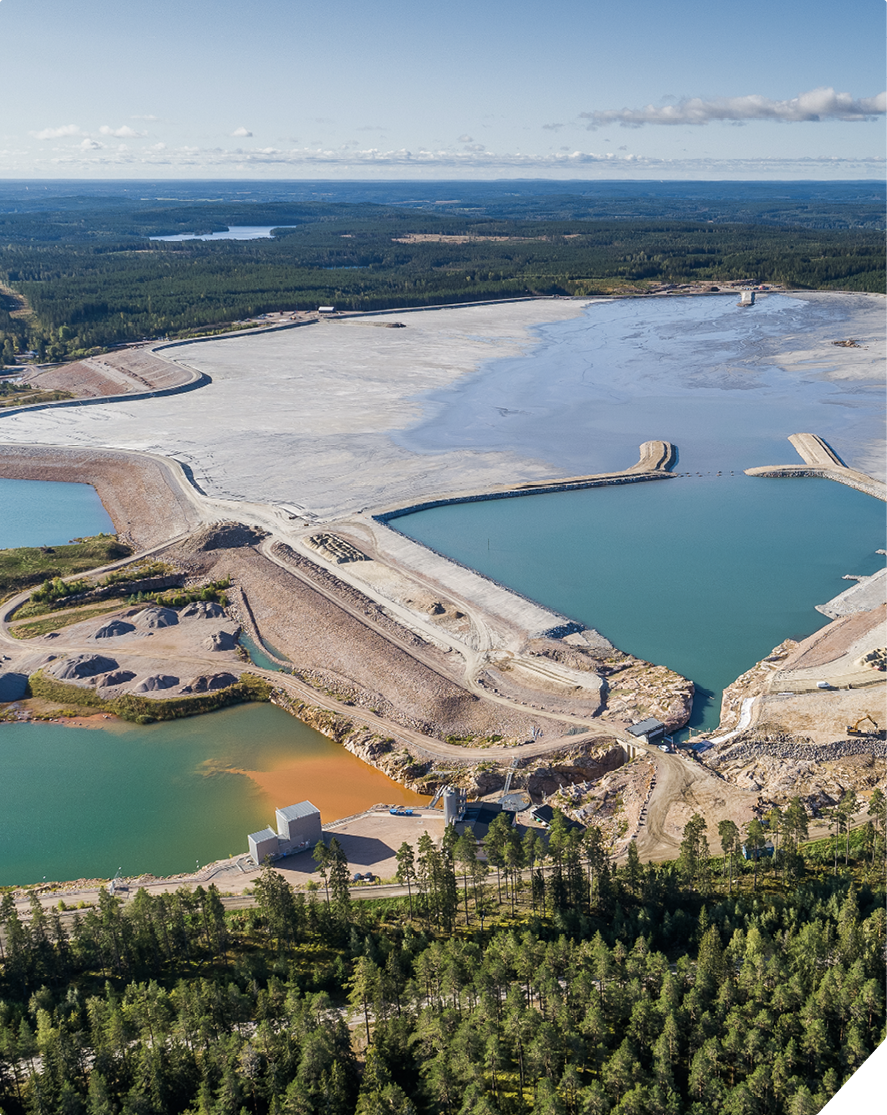
Aerial view of the tailings pond in Garpenberg.
Photo: Svenska Kraftnät